Context for September: September saw strikes across the country and across industries. Screenwriters, auto workers, actors, and healthcare workers fought for better pay and employment terms.
This comes amid peak interest rates and a narrowly-avoided government shutdown. But what’s happening on Main Street?
Amid multiple strikes, a near government shutdown and high interest rates, Main Street businesses grapple with their own unique realities on-the-ground. September saw rising wages, New York City flooding, and seasonal slowdowns. Homebase seeks to understand how the broader economic environment is affecting small businesses and their employees during the end of Q3 by analyzing behavioral data from more than two million employees working at more than one hundred thousand SMBs.
Main Street at a glance:
Hourly workers join the “Big Stay”— opting to stay in their jobs for longer— as wages rises, employee turnover takes a dive, and optimism on future jobs declines.
Plus, last weekend’s extreme rainfall and flooding hit New York City SMBs hard. But the very next day, these tough teams were back in business at almost normal levels.
New and noteworthy:
- Main Street worker wages continued to rise in September, despite a decision by the Federal Reserve Bank to pause interest rates, as inflation appears to cool.
- Most industries saw a seasonal dip in employees working in September, though Hospitality and Entertainment at a lesser rate than prior years.
- Foot traffic for small businesses in NYC dropped over the weekend, as heavy rainfall caused severe flooding, resulting in a state of emergency.
Persistent wage growth continued in September on Main Street
Summerlong wage inflation continued for workers. Labor costs rose as owners continued to invest in attracting and retaining teams amid inflation uncertainty.
Avg. wage changes, m/m
Monthly change in average hourly wages across all jobs
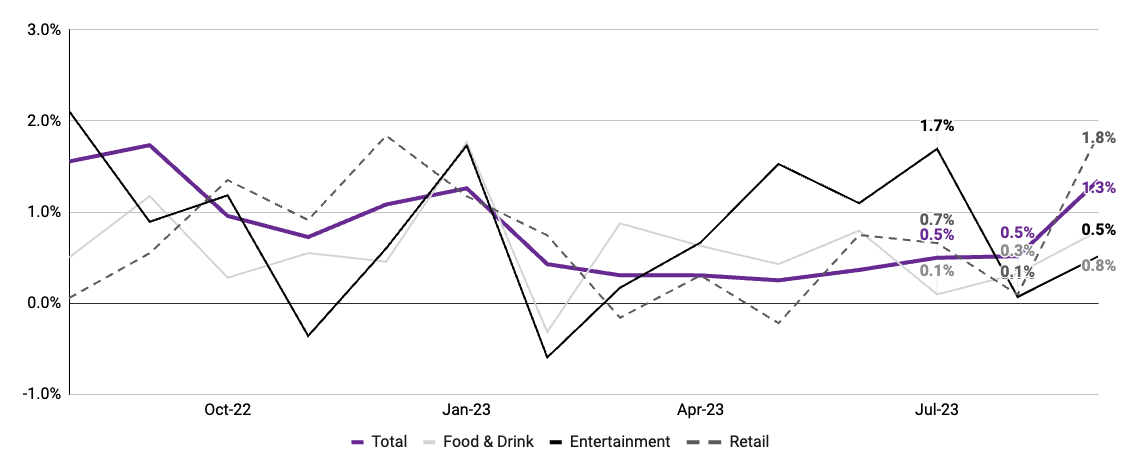
Note: Data measures average hourly wages for locations that utilized Homebase to pay employees in both September 2022 and September 2023. Total includes industries not depicted here. Source: Homebase Payroll data.
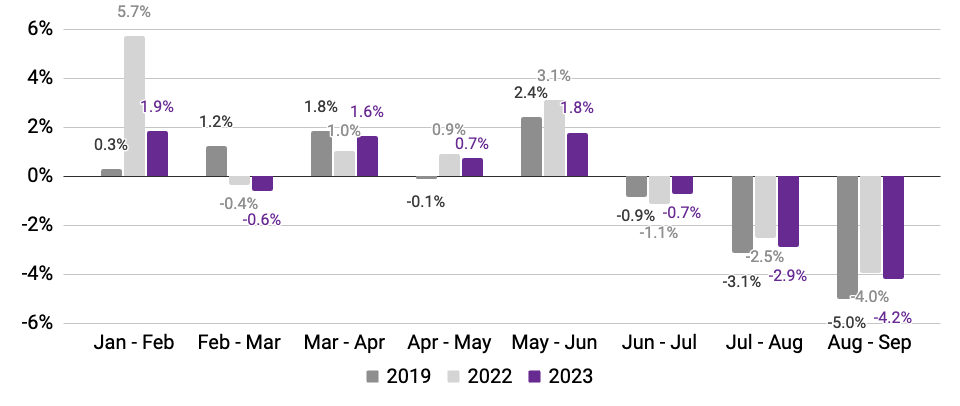
SMBs saw seasonal September slowdown
Hours worked saw a steeper decline than employees working, signaling workers received fewer hours as summer ends and foot traffic falls.
Employees working
(Monthly change in 7-day average, relative to January of reported year)
Hours worked
(Monthly change in 7-day average, relative to January of reported year)
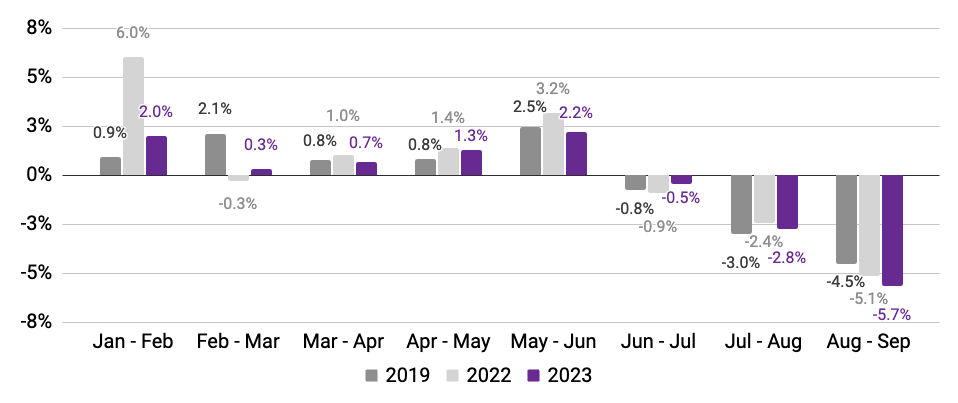
Data compares rolling 7-day averages for weeks encompassing the 12th of each month; April data encompasses the subsequent week to account for Easter holiday. Source: Homebase data.
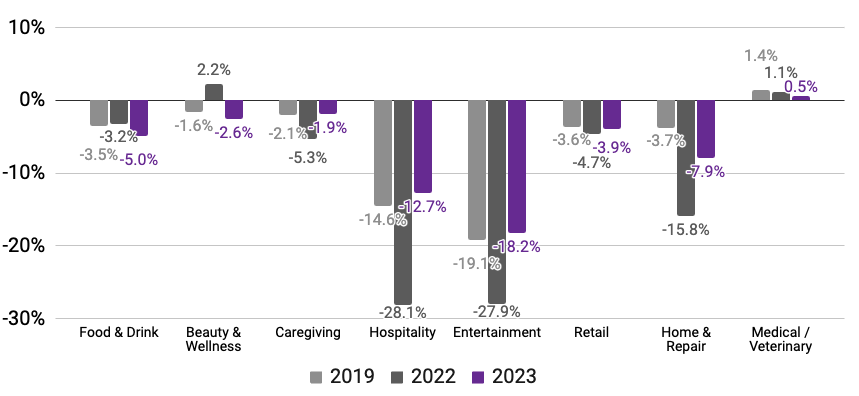
Fewer employees worked in September, in line with expectation
Most industries saw a seasonal dip in employees working, though Hospitality and Entertainment saw a more muted decline in 2023 than prior years.
Both Hospitality¹ and Entertainment² saw a seasonal decline in employees working in September, but at a lesser rate than previous years (-12.7% and -18.2%, respectively).
Across both industries, less staffing up early in the summer meant a softer declines in September. Although, Entertainment saw a more pronounced change in employees working on either sides of summer, likely due to outdoor events benefiting from warmer weather.
Percent change in employees working
(Mid-September vs. mid-August, using Jan. ‘19, Jan. ‘22, and Jan. ‘23 baselines)³
- Hospitality includes tourism and hotel/lodging businesses.
- Entertainment includes events/festivals, sports/recreation, parks, movie theaters, and other categories.
- September 8-14 vs. August 11-17 (2019); September 11-17 vs. August 7-13 (2022); September 10-16 vs. August 6-12 (2023). Source: Homebase data
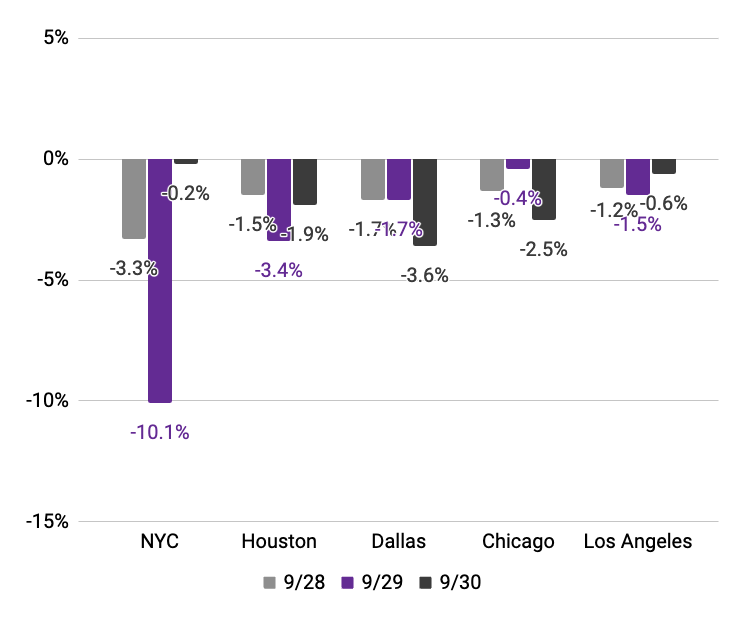
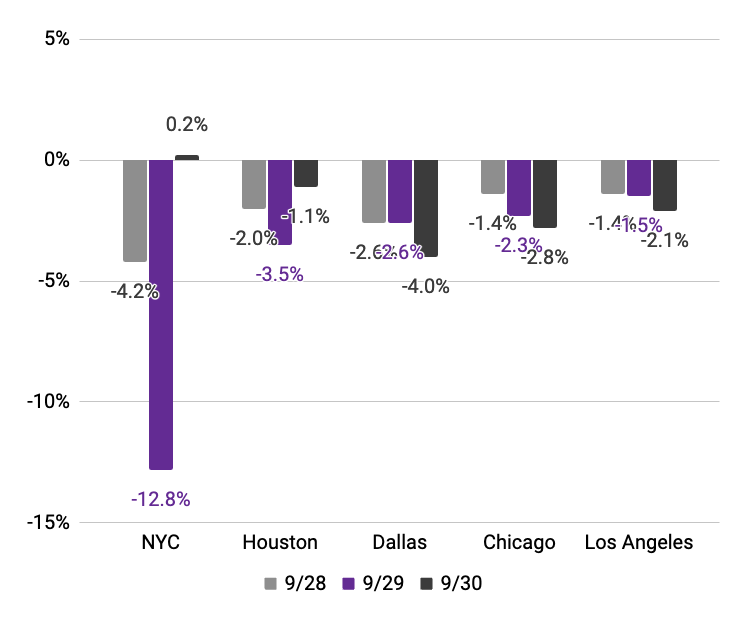
New York’s SMBs were hard hit by emergency rainfall and flooding, but these tough teams bounced back almost immediately
Heavy rains in the New York area forced widespread shutdowns, and SMBs felt the impact directly on Friday. However, we saw an immediate recovery Saturday, as activity levels outpaced the prior week and jumped more than other large metro areas.
Employees working
(Weekly change in metrics, relative to January 2023 levels)
Hours worked
(Weekly change in metrics, relative to January 2023 levels)
Businesses open
(Weekly change in metrics, relative to January 2023 levels)
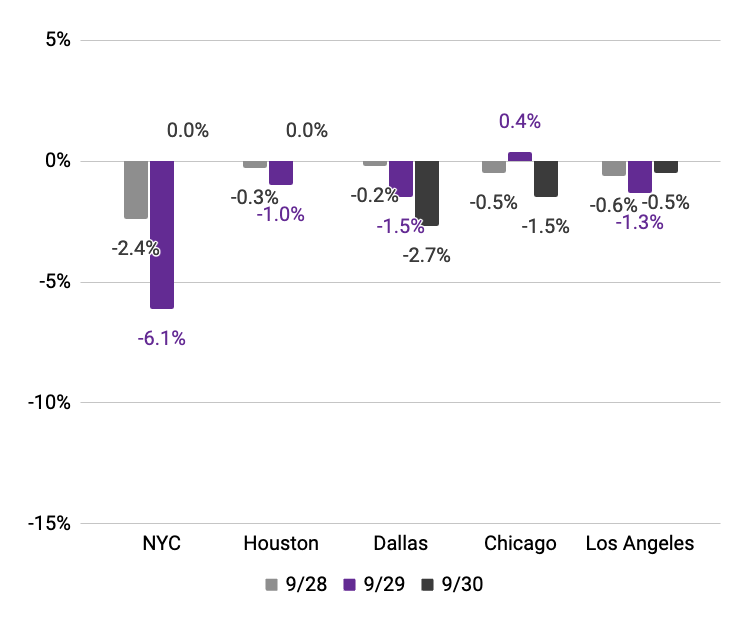
Note: Data compares changes in relative activity levels versus prior week (i.e., Thursday 9/28 vs. Thursday 9/21). Source: Homebase data.
Main Street sees seasonal fall slowdown
The Northeast saw the greatest dip in employment activity, as summer came to a close.
Output by MSA
Month-over-month change in core economic indicators, by metropolitan statistical area
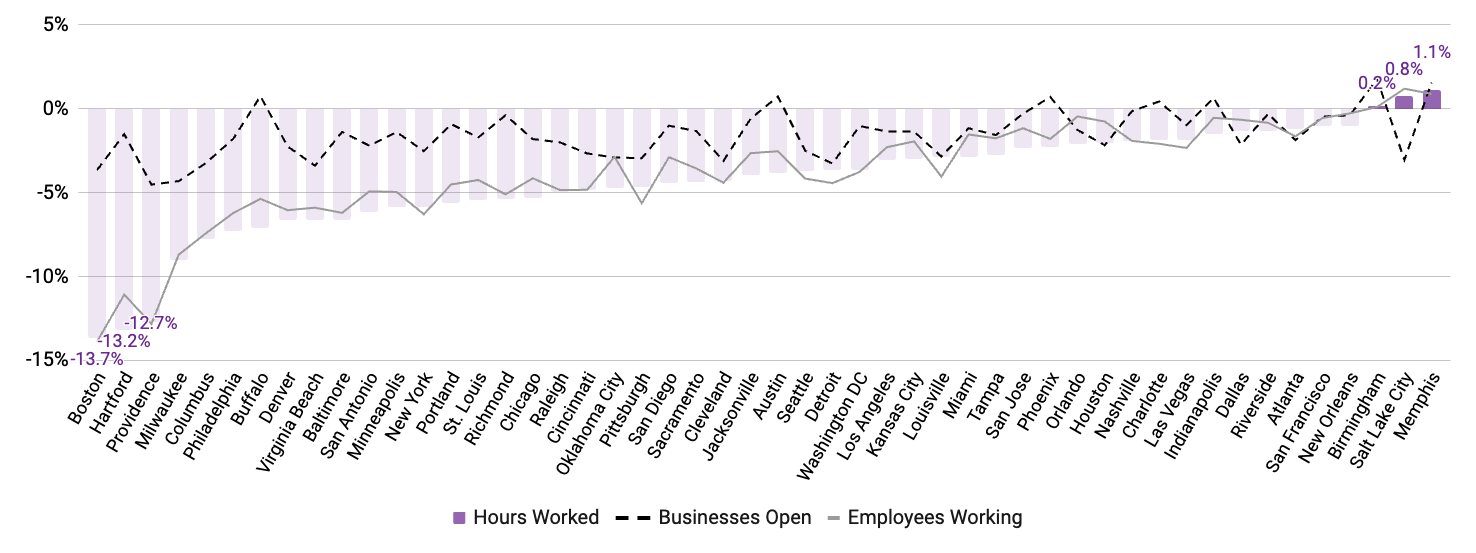
Note: September 10-16 vs. August 6-12. Source: Homebase data
Hiring dipped as summer transitioned into back-to-school
m/m changes in average jobs created
Monthly change in average number of jobs added across all jobs
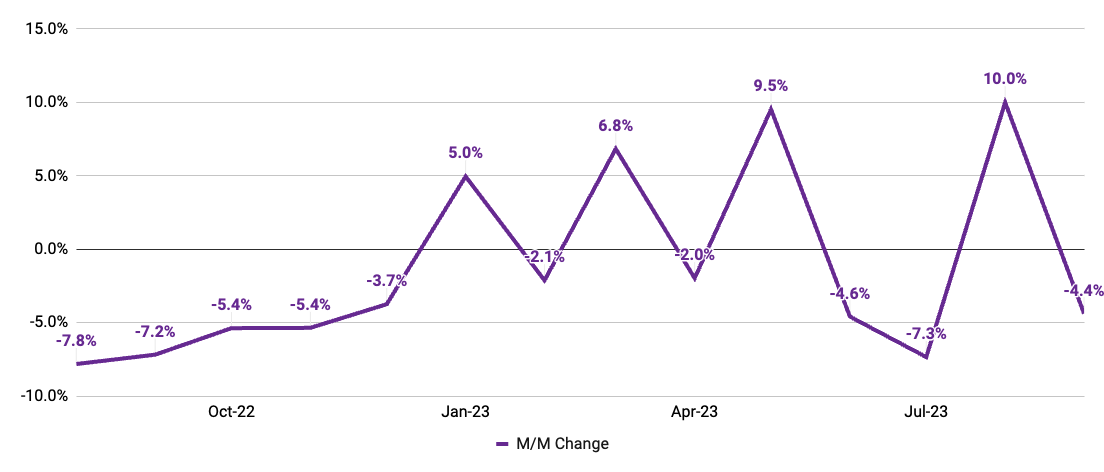
Note: Data measures average monthly change in total number of jobs created in official employee rosters for companies active in any given month. Source: Homebase data.
Turnover rates at SMBs dropped sharply in September
m/m changes in average number of jobs removed
Monthly change in average jobs archived across all jobs
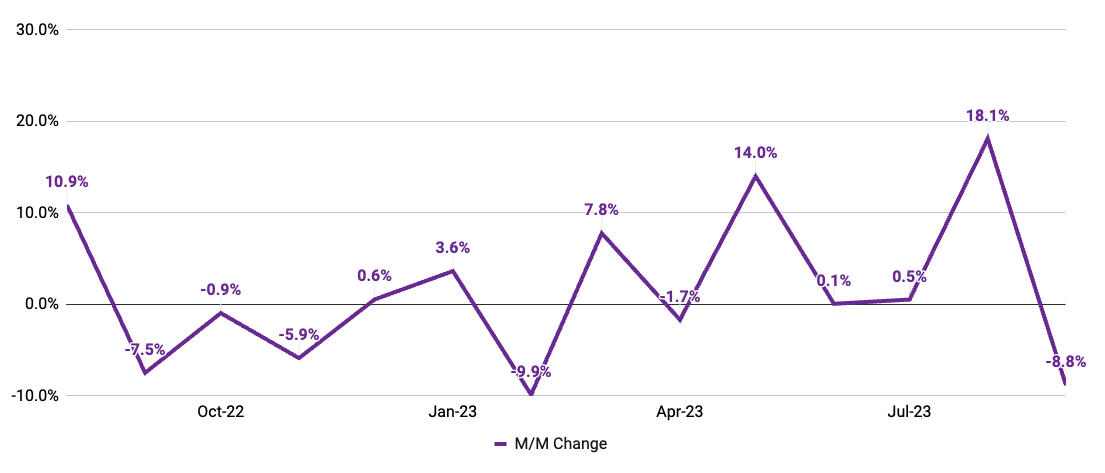
Note: Data measures average monthly change in total number of jobs removed, whether by voluntary or involuntary exit, from official employee rosters for companies active in any given month. Source: Homebase data.
Employees worked fewer shifts on average heading into the fall
m/m changes in average number of shifts
Monthly change in average shifts worked across all jobs
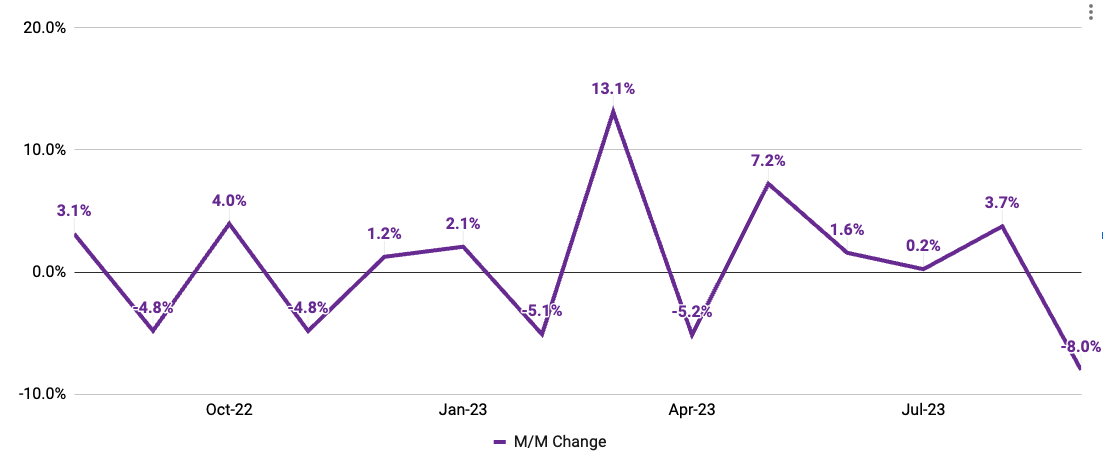
Note: Data measures average monthly change in total clock-ins for companies active in any given month. Source: Homebase data.
Link to PDF of: September 2023 Homebase Main Street Health Report If you choose to use this data for research or reporting purposes, please cite Homebase.


